


Western district, Monongalia County, West Virginia
About
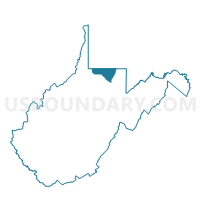
Outline

Summary
| Unique Area Identifier | 155828 |
| Name | Western district |
| County | Monongalia County |
| State | West Virginia |
| Area (square miles) | 272.88 |
| Land Area (square miles) | 270.69 |
| Water Area (square miles) | 2.18 |
| % of Land Area | 99.20 |
| % of Water Area | 0.80 |
| Latitude of the Internal Point | 39.61766220 |
| Longtitude of the Internal Point | -80.09636900 |
| Total Population | 27,045 |
| Total Housing Units | 12,090 |
| Total Households | 11,066 |
| Median Age | 40.1 |
Maps


Graphs
Select a template below for downloading or customizing gragh for Western district, Monongalia County, West Virginia


Neighbors
Neighoring County Subdivision (by Name) Neighboring County Subdivision on the Map
- District 1, Wetzel County, WV
- Central district, Monongalia County, WV
- Dunkard township, Greene County, PA
- Eastern district, Monongalia County, WV
- Eastern district, Taylor County, WV
- First district, Preston County, WV
- Freeport township, Greene County, PA
- Gilmore township, Greene County, PA
- Palatine district, Marion County, WV
- Perry township, Greene County, PA
- Springhill township, Fayette County, PA
- Third district, Preston County, WV
- Wayne township, Greene County, PA
- West Augusta district, Marion County, WV
Top 10 Neighboring Place (by Population) Neighboring Place on the Map
- Morgantown city, WV (29,660)
- Brookhaven CDP, WV (5,171)
- Westover city, WV (3,983)
- Star City town, WV (1,825)
- Granville town, WV (781)
- Mount Morris CDP, PA (737)
- Cassville CDP, WV (701)
- Brave CDP, PA (201)
- Pentress CDP, WV (175)
- Blacksville town, WV (171)
Top 10 Neighboring Unified School District (by Population) Neighboring Unified School District on the Map
- Monongalia School District, WV (96,189)
- Marion County School District, WV (56,418)
- Preston County School District, WV (33,520)
- Albert Gallatin Area School District, PA (23,880)
- Taylor County School District, WV (16,895)
- Wetzel County School District, WV (16,583)
- Central Greene School District, PA (15,921)
- West Greene School District, PA (5,108)
- Southeastern Greene School District, PA (4,649)
Top 10 Neighboring State Legislative District Lower Chamber (by Population) Neighboring State Legislative District Lower Chamber on the Map
- State House District 44, WV (89,802)
- State House District 50, PA (59,028)
- State House District 51, PA (56,731)
- State House District 43, WV (56,711)
- State House District 45, WV (22,068)
- State House District 42, WV (19,954)
- State House District 46, WV (18,593)
- State House District 5, WV (16,663)
Top 10 Neighboring State Legislative District Upper Chamber (by Population) Neighboring State Legislative District Upper Chamber on the Map
- State Senate District 46, PA (235,908)
- State Senate District 32, PA (225,580)
- State Senate District 13, WV (122,633)
- State Senate District 14, WV (121,969)
- State Senate District 2, WV (101,327)
Top 10 Neighboring 111th Congressional District (by Population) Neighboring 111th Congressional District on the Map
Top 10 Neighboring Census Tract (by Population) Neighboring Census Tract on the Map
- Census Tract 2631, Fayette County, PA (5,871)
- Census Tract 9646, Taylor County, WV (5,406)
- Census Tract 210, Marion County, WV (5,275)
- Census Tract 116, Monongalia County, WV (5,097)
- Census Tract 115, Monongalia County, WV (4,708)
- Census Tract 110, Monongalia County, WV (4,659)
- Census Tract 216, Marion County, WV (4,482)
- Census Tract 9643, Preston County, WV (4,349)
- Census Tract 9704, Greene County, PA (4,290)
- Census Tract 9708, Greene County, PA (4,204)
Top 10 Neighboring 5-Digit ZIP Code Tabulation Area (by Population) Neighboring 5-Digit ZIP Code Tabulation Area on the Map
- 26554, WV (41,369)
- 26505, WV (38,772)
- 26508, WV (29,170)
- 26501, WV (19,616)
- 26354, WV (11,135)
- 26582, WV (5,335)
- 26570, WV (3,595)
- 26541, WV (2,624)
- 26588, WV (2,611)
- 26547, WV (2,376)
Data
Demographic, Population, Households, and Housing Units
** Data sources from census 2010 **
Show Data on Map
Download Full List as CSV
Download Quick Sheet as CSV
| Subject | This Area | Monongalia County | West Virginia | National |
|---|---|---|---|---|
| POPULATION | ||||
| Total Population Map | 27,045 | 96,189 | 1,852,994 | 308,745,538 |
| POPULATION, HISPANIC OR LATINO ORIGIN | ||||
| Not Hispanic or Latino Map | 26,792 | 94,497 | 1,830,726 | 258,267,944 |
| Hispanic or Latino Map | 253 | 1,692 | 22,268 | 50,477,594 |
| POPULATION, RACE | ||||
| White alone Map | 25,887 | 87,488 | 1,739,988 | 223,553,265 |
| Black or African American alone Map | 455 | 3,496 | 63,124 | 38,929,319 |
| American Indian and Alaska Native alone Map | 52 | 145 | 3,787 | 2,932,248 |
| Asian alone Map | 193 | 2,941 | 12,406 | 14,674,252 |
| Native Hawaiian and Other Pacific Islander alone Map | 7 | 48 | 428 | 540,013 |
| Some Other Race alone Map | 36 | 367 | 6,119 | 19,107,368 |
| Two or More Races Map | 415 | 1,704 | 27,142 | 9,009,073 |
| POPULATION, SEX | ||||
| Male Map | 13,479 | 49,600 | 913,586 | 151,781,326 |
| Female Map | 13,566 | 46,589 | 939,408 | 156,964,212 |
| POPULATION, AGE (18 YEARS) | ||||
| 18 years and over Map | 21,163 | 80,937 | 1,465,576 | 234,564,071 |
| Under 18 years | 5,882 | 15,252 | 387,418 | 74,181,467 |
| POPULATION, AGE | ||||
| Under 5 years | 1,565 | 4,467 | 104,060 | 20,201,362 |
| 5 to 9 years | 1,629 | 4,182 | 106,016 | 20,348,657 |
| 10 to 14 years | 1,617 | 4,056 | 109,045 | 20,677,194 |
| 15 to 17 years | 1,071 | 2,547 | 68,297 | 12,954,254 |
| 18 and 19 years | 655 | 7,231 | 51,795 | 9,086,089 |
| 20 years | 280 | 4,788 | 25,873 | 4,519,129 |
| 21 years | 275 | 4,492 | 24,305 | 4,354,294 |
| 22 to 24 years | 982 | 9,215 | 67,026 | 12,712,576 |
| 25 to 29 years | 1,736 | 8,376 | 108,444 | 21,101,849 |
| 30 to 34 years | 1,803 | 5,963 | 112,254 | 19,962,099 |
| 35 to 39 years | 1,854 | 5,200 | 117,136 | 20,179,642 |
| 40 to 44 years | 1,941 | 5,089 | 120,358 | 20,890,964 |
| 45 to 49 years | 2,044 | 5,376 | 132,924 | 22,708,591 |
| 50 to 54 years | 2,148 | 5,536 | 143,232 | 22,298,125 |
| 55 to 59 years | 2,064 | 5,467 | 139,368 | 19,664,805 |
| 60 and 61 years | 716 | 1,920 | 53,956 | 7,113,727 |
| 62 to 64 years | 941 | 2,458 | 71,501 | 9,704,197 |
| 65 and 66 years | 535 | 1,353 | 38,447 | 5,319,902 |
| 67 to 69 years | 712 | 1,747 | 53,281 | 7,115,361 |
| 70 to 74 years | 937 | 2,210 | 71,792 | 9,278,166 |
| 75 to 79 years | 681 | 1,719 | 54,725 | 7,317,795 |
| 80 to 84 years | 508 | 1,514 | 43,238 | 5,743,327 |
| 85 years and over | 351 | 1,283 | 35,921 | 5,493,433 |
| MEDIAN AGE BY SEX | ||||
| Both sexes Map | 40.10 | 29.10 | 41.30 | 37.20 |
| Male Map | 39.10 | 28.20 | 40.10 | 35.80 |
| Female Map | 41.10 | 30.30 | 42.60 | 38.50 |
| HOUSEHOLDS | ||||
| Total Households Map | 11,066 | 39,777 | 763,831 | 116,716,292 |
| HOUSEHOLDS, HOUSEHOLD TYPE | ||||
| Family households: Map | 7,527 | 20,032 | 502,332 | 77,538,296 |
| Husband-wife family Map | 5,938 | 15,221 | 380,426 | 56,510,377 |
| Other family: Map | 1,589 | 4,811 | 121,906 | 21,027,919 |
| Male householder, no wife present Map | 520 | 1,554 | 36,374 | 5,777,570 |
| Female householder, no husband present Map | 1,069 | 3,257 | 85,532 | 15,250,349 |
| Nonfamily households: Map | 3,539 | 19,745 | 261,499 | 39,177,996 |
| Householder living alone Map | 2,855 | 12,614 | 217,308 | 31,204,909 |
| Householder not living alone Map | 684 | 7,131 | 44,191 | 7,973,087 |
| HOUSEHOLDS, HISPANIC OR LATINO ORIGIN OF HOUSEHOLDER | ||||
| Not Hispanic or Latino householder: Map | 10,997 | 39,255 | 757,775 | 103,254,926 |
| Hispanic or Latino householder: Map | 69 | 522 | 6,056 | 13,461,366 |
| HOUSEHOLDS, RACE OF HOUSEHOLDER | ||||
| Householder who is White alone | 10,702 | 36,778 | 725,684 | 89,754,352 |
| Householder who is Black or African American alone | 189 | 1,154 | 23,832 | 14,129,983 |
| Householder who is American Indian and Alaska Native alone | 20 | 65 | 1,655 | 939,707 |
| Householder who is Asian alone | 52 | 1,186 | 4,304 | 4,632,164 |
| Householder who is Native Hawaiian and Other Pacific Islander alone | 1 | 18 | 121 | 143,932 |
| Householder who is Some Other Race alone | 12 | 95 | 1,415 | 4,916,427 |
| Householder who is Two or More Races | 90 | 481 | 6,820 | 2,199,727 |
| HOUSEHOLDS, HOUSEHOLD TYPE BY HOUSEHOLD SIZE | ||||
| Family households: Map | 7,527 | 20,032 | 502,332 | 77,538,296 |
| 2-person household Map | 3,444 | 9,552 | 241,530 | 31,882,616 |
| 3-person household Map | 1,810 | 4,856 | 120,007 | 17,765,829 |
| 4-person household Map | 1,437 | 3,606 | 87,596 | 15,214,075 |
| 5-person household Map | 543 | 1,376 | 35,494 | 7,411,997 |
| 6-person household Map | 206 | 440 | 11,701 | 3,026,278 |
| 7-or-more-person household Map | 87 | 202 | 6,004 | 2,237,501 |
| Nonfamily households: Map | 3,539 | 19,745 | 261,499 | 39,177,996 |
| 1-person household Map | 2,855 | 12,614 | 217,308 | 31,204,909 |
| 2-person household Map | 589 | 4,989 | 36,807 | 6,360,012 |
| 3-person household Map | 69 | 1,510 | 4,872 | 992,156 |
| 4-person household Map | 14 | 515 | 1,841 | 411,171 |
| 5-person household Map | 10 | 94 | 488 | 126,634 |
| 6-person household Map | 1 | 17 | 111 | 48,421 |
| 7-or-more-person household Map | 1 | 6 | 72 | 34,693 |
| HOUSING UNITS | ||||
| Total Housing Units Map | 12,090 | 43,238 | 881,917 | 131,704,730 |
| HOUSING UNITS, OCCUPANCY STATUS | ||||
| Occupied Map | 11,066 | 39,777 | 763,831 | 116,716,292 |
| Vacant Map | 1,024 | 3,461 | 118,086 | 14,988,438 |
| HOUSING UNITS, OCCUPIED, TENURE | ||||
| Owned with a mortgage or a loan Map | 4,513 | 13,007 | 293,522 | 52,979,430 |
| Owned free and clear Map | 3,950 | 9,132 | 267,491 | 23,006,644 |
| Renter occupied Map | 2,603 | 17,638 | 202,818 | 40,730,218 |
| HOUSING UNITS, VACANT, VACANCY STATUS | ||||
| For rent Map | 236 | 1,254 | 19,521 | 4,137,567 |
| Rented, not occupied Map | 12 | 61 | 1,366 | 206,825 |
| For sale only Map | 126 | 445 | 10,381 | 1,896,796 |
| Sold, not occupied Map | 63 | 144 | 4,597 | 421,032 |
| For seasonal, recreational, or occasional use Map | 165 | 546 | 38,283 | 4,649,298 |
| For migrant workers Map | 11 | 75 | 118 | 24,161 |
| Other vacant Map | 411 | 936 | 43,820 | 3,652,759 |
| HOUSING UNITS, OCCUPIED, AVERAGE HOUSEHOLD SIZE BY TENURE | ||||
| Total: Map | 2.44 | 2.24 | 2.36 | 2.58 |
| Owner occupied Map | 2.52 | 2.43 | 2.43 | 2.65 |
| Renter occupied Map | 2.18 | 2.00 | 2.18 | 2.44 |
| HOUSING UNITS, OCCUPIED, TENURE BY RACE OF HOUSEHOLDER | ||||
| Owner occupied: Map | 8,463 | 22,139 | 561,013 | 75,986,074 |
| Householder who is White alone Map | 8,275 | 21,198 | 542,432 | 63,446,275 |
| Householder who is Black or African American alone Map | 94 | 331 | 11,020 | 6,261,464 |
| Householder who is American Indian and Alaska Native alone Map | 8 | 26 | 953 | 509,588 |
| Householder who is Asian alone Map | 31 | 411 | 2,278 | 2,688,861 |
| Householder who is Native Hawaiian and Other Pacific Islander alone Map | 0 | 4 | 59 | 61,911 |
| Householder who is Some Other Race alone Map | 6 | 19 | 610 | 1,975,817 |
| Householder who is Two or More Races Map | 49 | 150 | 3,661 | 1,042,158 |
| Renter occupied: Map | 2,603 | 17,638 | 202,818 | 40,730,218 |
| Householder who is White alone Map | 2,427 | 15,580 | 183,252 | 26,308,077 |
| Householder who is Black or African American alone Map | 95 | 823 | 12,812 | 7,868,519 |
| Householder who is American Indian and Alaska Native alone Map | 12 | 39 | 702 | 430,119 |
| Householder who is Asian alone Map | 21 | 775 | 2,026 | 1,943,303 |
| Householder who is Native Hawaiian and Other Pacific Islander alone Map | 1 | 14 | 62 | 82,021 |
| Householder who is Some Other Race alone Map | 6 | 76 | 805 | 2,940,610 |
| Householder who is Two or More Races Map | 41 | 331 | 3,159 | 1,157,569 |
| HOUSING UNITS, OCCUPIED, TENURE BY HISPANIC OR LATINO ORIGIN OF HOUSEHOLDER | ||||
| Owner occupied: Map | 8,463 | 22,139 | 561,013 | 75,986,074 |
| Not Hispanic or Latino householder Map | 8,425 | 21,973 | 557,790 | 69,617,625 |
| Hispanic or Latino householder Map | 38 | 166 | 3,223 | 6,368,449 |
| Renter occupied: Map | 2,603 | 17,638 | 202,818 | 40,730,218 |
| Not Hispanic or Latino householder Map | 2,572 | 17,282 | 199,985 | 33,637,301 |
| Hispanic or Latino householder Map | 31 | 356 | 2,833 | 7,092,917 |
| HOUSING UNITS, OCCUPIED, TENURE BY HOUSEHOLD SIZE | ||||
| Owner occupied: Map | 8,463 | 22,139 | 561,013 | 75,986,074 |
| 1-person household Map | 1,851 | 5,461 | 134,762 | 16,453,569 |
| 2-person household Map | 3,218 | 8,471 | 222,574 | 27,618,605 |
| 3-person household Map | 1,505 | 3,775 | 94,220 | 12,517,563 |
| 4-person household Map | 1,222 | 2,870 | 69,097 | 10,998,793 |
| 5-person household Map | 438 | 1,075 | 27,123 | 5,057,765 |
| 6-person household Map | 158 | 340 | 8,750 | 1,965,796 |
| 7-or-more-person household Map | 71 | 147 | 4,487 | 1,373,983 |
| Renter occupied: Map | 2,603 | 17,638 | 202,818 | 40,730,218 |
| 1-person household Map | 1,004 | 7,153 | 82,546 | 14,751,340 |
| 2-person household Map | 815 | 6,070 | 55,763 | 10,624,023 |
| 3-person household Map | 374 | 2,591 | 30,659 | 6,240,422 |
| 4-person household Map | 229 | 1,251 | 20,340 | 4,626,453 |
| 5-person household Map | 115 | 395 | 8,859 | 2,480,866 |
| 6-person household Map | 49 | 117 | 3,062 | 1,108,903 |
| 7-or-more-person household Map | 17 | 61 | 1,589 | 898,211 |
Loading...